
The entry model comes first
In Part 1, we compared a 233 SMMA crossing policy with session VWAP and a frozen prior-week VWAP. That was a test of those particular policies. It did not establish that every form of VWAP behaves the same way.
Part 2 asks a different question: what happens when a slow trend reference and a causally selected anchored VWAP must agree before the model holds Bitcoin?
The 233 measures a long price history with a fixed smoothing coefficient. Anchored VWAP measures an average price weighted by volume since a specified starting point. Combining them is a hypothesis about eligibility to hold a position. It is not proof that the lines identify institutional buying or predict the next move.
The owner prefers 233 because it is a Fibonacci number and, in personal chart observation, appears less prone to fakeouts than 200. That preference motivates the baseline. This experiment does not test 233 against 200 or establish that Fibonacci status creates an edge.
Exact rules: anchor, confirm, enter, exit
| Stage | What the model actually does |
|---|---|
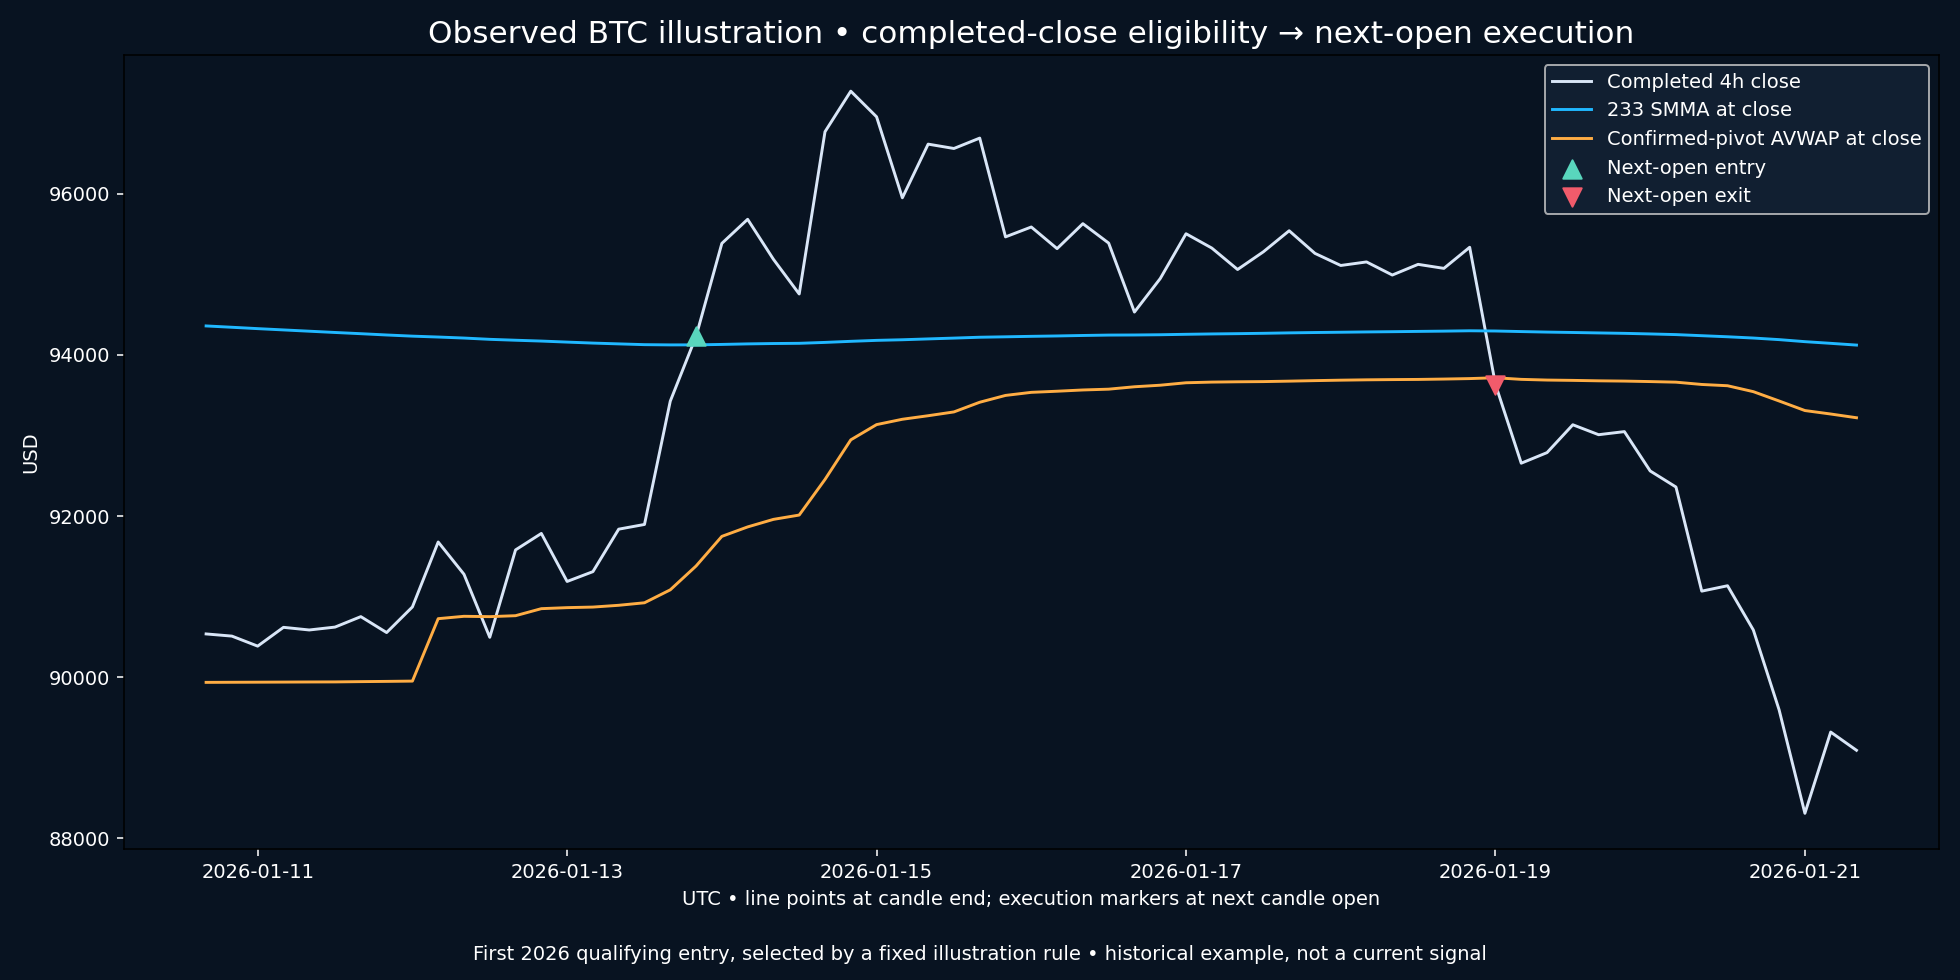
| Anchor candidate | Find a daily low that is the unique lowest low across seven daily candles: three before it, the candidate and three after it. All seven daily candles must contain 24 observed hourly candles. |
| Confirmation | Wait until the third following daily candle has closed. The anchor becomes available at the beginning of the next UTC day. Never credit an entry at the historical low before confirmation. |
| Anchored VWAP | Sum hourly HLC3 multiplied by hourly BTC volume from the confirmed low’s day onward, divided by accumulated volume. The most recently confirmed qualifying low replaces the previous anchor. |
| Entry signal | On the tested 4h, 8h or daily timeframe, a completed close is strictly above both the 233 SMMA and the available anchored VWAP, and the preceding eligibility state was false. |
| Entry execution | Enter long at the next available signal candle’s open. One unlevered long/cash position; no pyramiding. |
| Exit signal | A completed close is at or below either reference, so the combined eligibility state becomes false. |
| Exit execution | Exit at the next available signal candle’s open. Liquidate any remaining position at the final observed close when calculating total returns. |
The 233 is seeded with the mean of its first 233 completed timeframe closes, then updated with a coefficient of 1/233. Anchored VWAP uses hourly data on every tested timeframe, so switching the signal timeframe does not change the underlying hourly volume calculation.
The model does not require price to cross both lines simultaneously. If price is already above the 233, a close back above anchored VWAP can establish eligibility. If it is already above anchored VWAP, reclaiming the 233 can establish eligibility. An anchor replacement can also change eligibility; this is a state-based rule, not exclusively a price crossing a stationary line.
During evaluation the model starts in cash, then follows the preceding completed candle’s eligibility at the next open. Equality is ineligible. An unavailable reference is ineligible. Gaps can delay execution to the next available aggregated candle; that is a limitation of this dataset, not an assumption that a trader could always fill at the intended uninterrupted clock time.
What was not in this model
There was no pullback retest, two-close confirmation, 21/55 crossover, RSI filter, stop-loss, profit target, leverage or discretionary override. The exit was loss of either eligibility condition. A different exit could materially change the result, so the entry rules and exit rules must be read together.
A chart may make a retest entry look attractive. This experiment did not measure that model. A retest, a breakout with a stop, or a 21/55 trigger filtered by these lines would be a separate experiment requiring its own opportunity definitions and cost accounting.
Results: the combination helped on 4h, not everywhere
Evaluation runs from January 1, 2024 through the last completed October 9, 2026 UTC data, using earlier history for warmup. Results below are compounded simulated returns after an assumed 10 basis points per side—0.10% on entry and 0.10% on exit—with final liquidation included. They are not live account results.
| Timeframe | 233 alone: return / drawdown / entries | Pivot AVWAP alone: return / drawdown / entries | Combined: return / drawdown / entries |
|---|---|---|---|
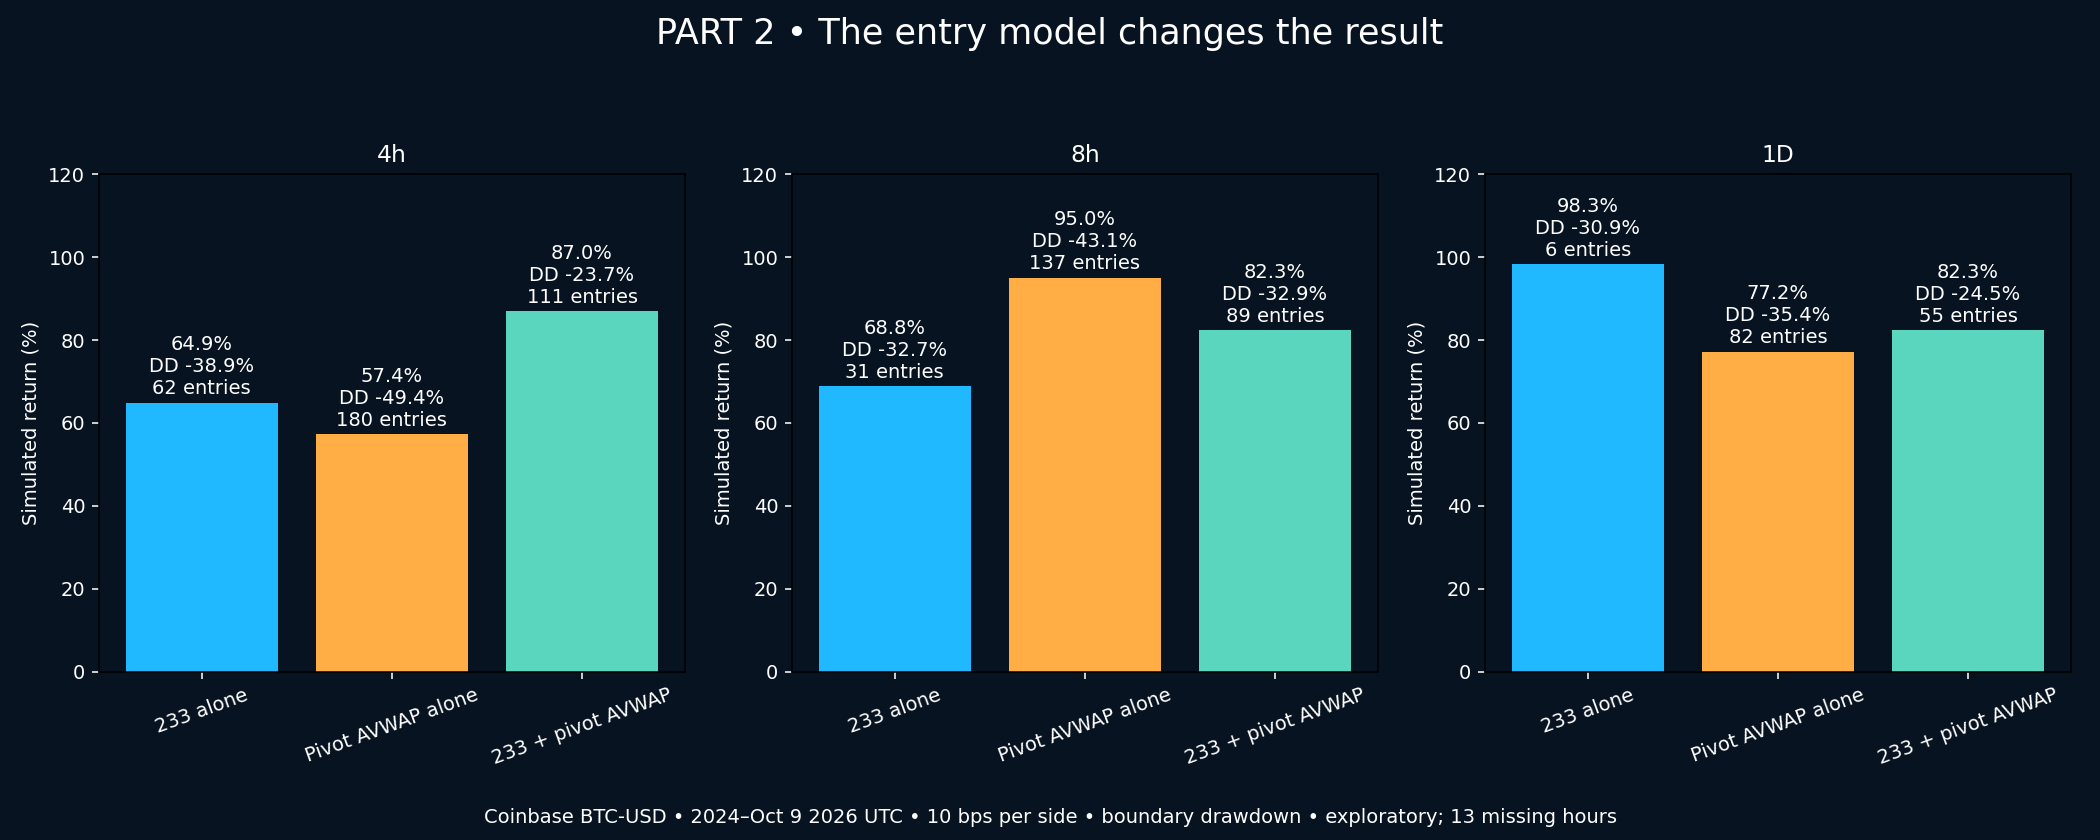
| 4h | +64.9% / −38.9% / 62 | +57.4% / −49.4% / 180 | +87.0% / −23.7% / 111 |
| 8h | +68.8% / −32.7% / 31 | +95.0% / −43.1% / 137 | +82.3% / −32.9% / 89 |
| Daily | +98.3% / −30.9% / 6 | +77.2% / −35.4% / 82 | +82.3% / −24.5% / 55 |
Drawdown here is measured at observed bar boundaries, not continuously within candles. The daily 233 result has only six entries, which limits how much confidence should be placed in its apparent advantage.
On 4h, the combination increased return by about 22.1 percentage points and reduced the magnitude of measured drawdown by about 15.3 points relative to the 233 alone. It also increased entries from 62 to 111. Additional confirmation reduced time in the market but did not reduce turnover: a second condition creates additional exits and later re-entries.
On 8h, the combination improved return over the 233 but left measured drawdown approximately unchanged. Anchored VWAP alone generated a higher return, with more entries and a deeper drawdown. On daily, the combination surrendered return in exchange for a smaller measured drawdown.
Uninterrupted holding returned approximately +94.6%, +93.9% and +86.3% on the corresponding 4h, 8h and daily execution grids, with bar-boundary drawdowns near −53%. Entry timing differs slightly between grids. The 4h combination therefore did not beat holding on total return; its distinction in this sample was the smaller measured drawdown.
The anchor is part of the strategy
We also tested calendar-anchored VWAP beginning each UTC week and each UTC month. Those references reset according to the calendar rather than a confirmed low. They should not be substituted for the pivot model while quoting its results.
Monthly anchored VWAP alone returned +22.1% on 4h, +82.0% on 8h and +87.8% on daily at the same costs. Requiring both monthly AVWAP and the 233 returned +54.3%, +52.9% and +53.9%, respectively. These combinations did not improve return over the 233 baseline.
An anchor selected retrospectively at the perfect bottom is not a fair mechanical entry rule. Our low is selected only after confirmation, and that delay is part of the model. Other causal anchors—earnings, a session open, a confirmed high or a predetermined event—are different hypotheses.
Fixed Range Volume Profile has not earned a verdict
Fixed Range Volume Profile distributes volume across price levels. Anchored VWAP produces a weighted average price through time. A frozen range VWAP is not a Volume Profile.
For a preliminary profile test, we used the previous fully observed UTC week, 48 equal-price bins and a contiguous 70% value area expanded from the point of control. The completed profile was frozen for the next week. Incomplete weeks supplied no profile, rather than manufactured levels.
Hourly OHLCV does not reveal where each unit actually traded inside the candle. We therefore used two explicit proxies: allocating each candle’s volume entirely to HLC3, or spreading it uniformly across its low–high range. Neither is a reconstruction of actual trade prints or a claim to reproduce TradingView exactly.
The 4h POC-only result changed from +16.8% to +50.7% when we changed the allocation method. The 8h result changed from +60.1% to +87.5%. That sensitivity is a reason to obtain finer data, not a reason to select the most flattering version. Adding the POC proxy to the 233 did not consistently improve return. A proper profile study remains open.
What would strengthen—or weaken—the finding
The causal-pivot combination is a candidate for further research. Its promise would strengthen if the frozen rules retained favorable return/drawdown trade-offs on new observations, different market regimes and realistic venue-specific costs. It would weaken if the improvement disappeared when gaps were repaired, fees increased, anchor definitions changed modestly, or independent replication failed.
The original dataset contains 41,819 Coinbase BTC-USD hourly candles beginning January 1, 2022 and 13 missing hourly intervals. Incomplete signal bars are omitted; indicator memory and returns can bridge those gaps. No prices or missing volume were fabricated. This study reuses history already examined in Part 1. It is exploratory, not an untouched out-of-sample test or a selection-adjusted statistical significance result.
The full experiment considered 16 policies across three timeframes and three assumed cost levels. Finding the most attractive result among many comparisons creates selection risk. No universal winner, gold/futures result, validation of the owner’s full 21/55 approach, or live trading recommendation follows from this comparison.
The useful conclusion
Two lines do not create a strategy by themselves. A strategy must specify when an anchor becomes known, which completed candle establishes eligibility, when execution occurs, what exits the position and what every change costs.
In this historical BTC sample, the 4h confirmed-pivot AVWAP plus 233 model improved return and measured drawdown relative to the 233 alone. The same benefit did not carry uniformly to the other timeframes or anchor choices. That is the finding worth preserving—and the reason traders should backtest their own exact rules instead of borrowing a result from a different entry model.
Sources and credits
• Part 1: 233 vs VWAP — The Line That Survived the Trading Costs
• Coinbase Exchange historical candle documentation
• TradingView: Anchored VWAP drawing tool
• TradingView: Volume Profile basic concepts
Author and original calculations: APEX Intelligence / APEX Research. Market data: Coinbase Exchange BTC-USD. Indicator definitions: TradingView documentation; APEX’s specified anchor and execution policies are its own research implementation. Original cover illustration is conceptual, not market data. Research data ends October 9, 2026 UTC; publication date October 10, 2026. Part 1 is preserved unchanged.
Not financial advice. Always trade with a plan and proper risk management.