The approved Edition 2 master includes the final cover, corrected section order, accessible image descriptions, and structured table headers.
APEX Research · The Living Market Compendium
The Grand Unified Field of Waves
A continuously updated research thesis connecting wave structure, market cycles, behavioral evidence, historical frameworks, and testable indicator concepts. The work is a research system—not a prediction engine.
Edition 2.0By APEX Research168 pagesContinuously UpdatedMember Edition
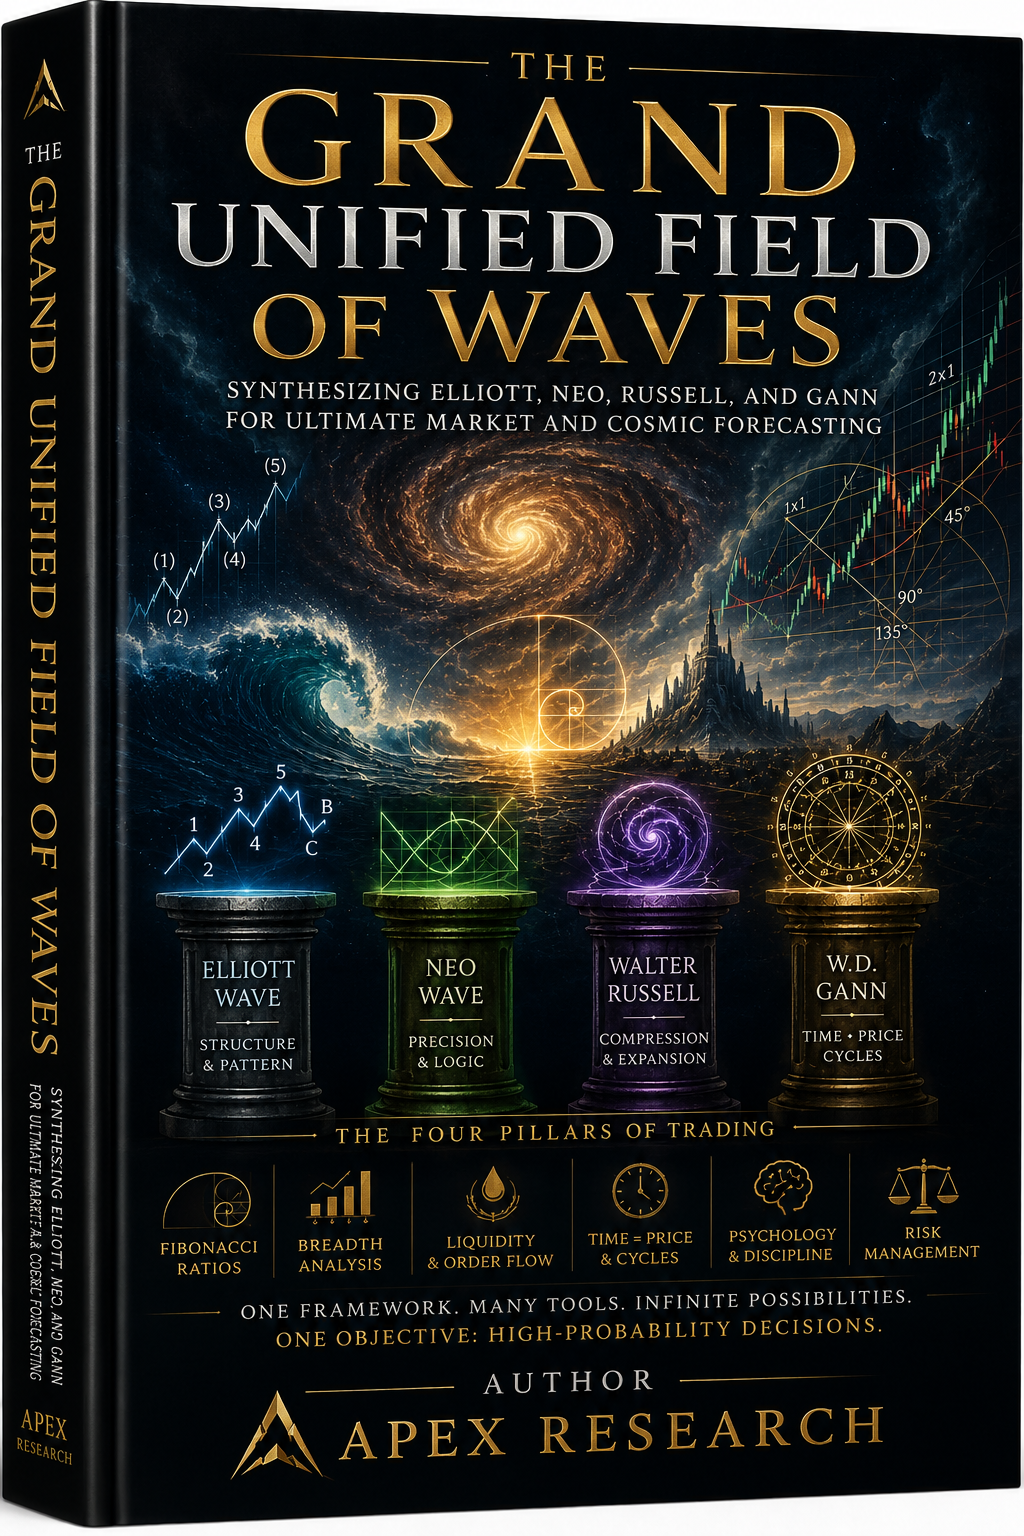
Current Edition
Edition 2 is the active research record.
This publication consolidates the expanded APEX framework, indicator encyclopedia, strategy and playbook material, historical regime probability concept, visual studies, glossary, and the complete decision chain.
Historical foundations and established methods are separated from APEX interpretations, hypotheses, and indicator concepts.
Future changes must identify what changed, why it changed, and which evidence or falsification test justified the revision.
What Is the Living Thesis?
A framework that can change when the evidence changes.
The Living Thesis treats markets as nested, interacting waves across price, time, participation, liquidity, structure, and psychology. It joins classical market frameworks with explicit validation rules so observations can become testable research rather than fixed belief.
Core Framework
One field. Multiple lenses.
Elliott, Dow, Russell, and Gann provide structural and cyclical lenses.
Wyckoff, Livermore, and Darvas connect participation, pivotal points, and confirmation.
Price, time, volatility, breadth, volume, liquidity, and regime are treated as distinct evidence streams.
Regime, structure, scenario, trigger, invalidation, target, risk, and review form the final chain.
Latest Research Updates
What Edition 2 adds.
APEX Indicator Encyclopedia
Organizes what each tool measures, how APEX uses it, and the limitation that must remain visible.
Historical Regime Probability concept
Defines a non-repainting research direction for regime classification, duration analysis, and transition probabilities.
Complete decision chain
Links evidence to action through regime, structure, scenarios, trigger, invalidation, target, risk, and journal validation.
Change Log
Every material revision stays traceable.
Edition 2 publication release
Final cover embedded; draft labels removed; unintended blank page corrected; closing note moved to the true end; PDF tagging and document accessibility metadata completed.
Under Investigation
Questions that remain open.
Can projected levels remain stable across linear and logarithmic display choices?
How do duration, volatility, breadth, and participation alter regime probabilities?
Which indicator concepts retain utility after closed-bar rules, parameter discipline, and falsification tests?
Visual Library
Diagrams are evidence maps, not decoration.
Edition 2 includes integrated visual studies covering wave structure, cycles, synthesis frameworks, regime logic, market tools, indicator architecture, and decision sequencing. Each visual belongs beside the assumption or measurement it is meant to clarify.
Indicator Lifecycle
From observation to accountable release.
Identify a repeatable market behavior.
Specify inputs, logic, and interpretation.
Use closed bars and explicit parameters.
Test regimes, history, and falsification.
State failure modes and misuse risks.
Publish with versioned evidence and change log.
Research and education only. Nothing in the Living Thesis is financial advice, a guarantee, or a substitute for independent judgment and risk management.