
There is a difference between a line that looks good on a chart and a rule that survives trading it.
The APEX owner prefers the 233 SMMA because 233 is a Fibonacci number and, in personal chart experience, the line appears to produce fewer fakeouts than a 200-period reference. That observation gave us a research question. It did not give us an answer.
We compared the 233 against session VWAP and a precisely defined fixed-range VWAP using real Coinbase BTC-USD candles. The initial results favor the 233 crossing rules after costs. They also show why publishing a simple “233 wins” headline without explaining the test would overstate the evidence.
Three lines, three different jobs
The 233 SMMA smooths price using a fixed update rate. Each new close changes the previous value by one two-hundred-and-thirty-third of the distance between them. Its memory fades gradually rather than resetting at a session boundary.
Session VWAP weights prices by reported volume within the current session. In this study, the session is a UTC calendar day. It describes where trading occurred during that interval; it does not identify the current cost basis of every market participant.
Our fixed-range VWAP uses the previous completed UTC week. Its final value is frozen throughout the next week. That gives us a historical reference that was available before the next week’s decisions. It avoids drawing a range after seeing the result.
This is different from Fixed Range Volume Profile, which describes volume distributed across price levels. It is also different from an anchored VWAP that keeps developing from a chosen event. Those deserve separately specified tests.
What we actually tested
We downloaded 41,819 hourly Coinbase BTC-USD candles, covering January 1, 2022 through October 9, 2026 at 23:00 UTC. The evaluation begins in January 2024; earlier history initializes the filters.
We built four-hour, eight-hour and daily bars. For each reference, the rule was deliberately simple: a completed close crossing above the line permits a long at the next bar’s open; a completed close crossing below exits at the next open. The test is unlevered and long-only, with no stop-loss or profit target.
VWAP uses hourly HLC3 prices weighted by hourly volume. This is a bar-based approximation, not an exact reconstruction of individual transactions.
We tested zero, 0.10% and 0.25% cost per side. These are illustrative execution-cost assumptions, not a verified personal fee schedule. The main comparison below uses 0.10% on entry and 0.10% on exit, compounds returns, and liquidates any remaining position at the final completed close.
The first results
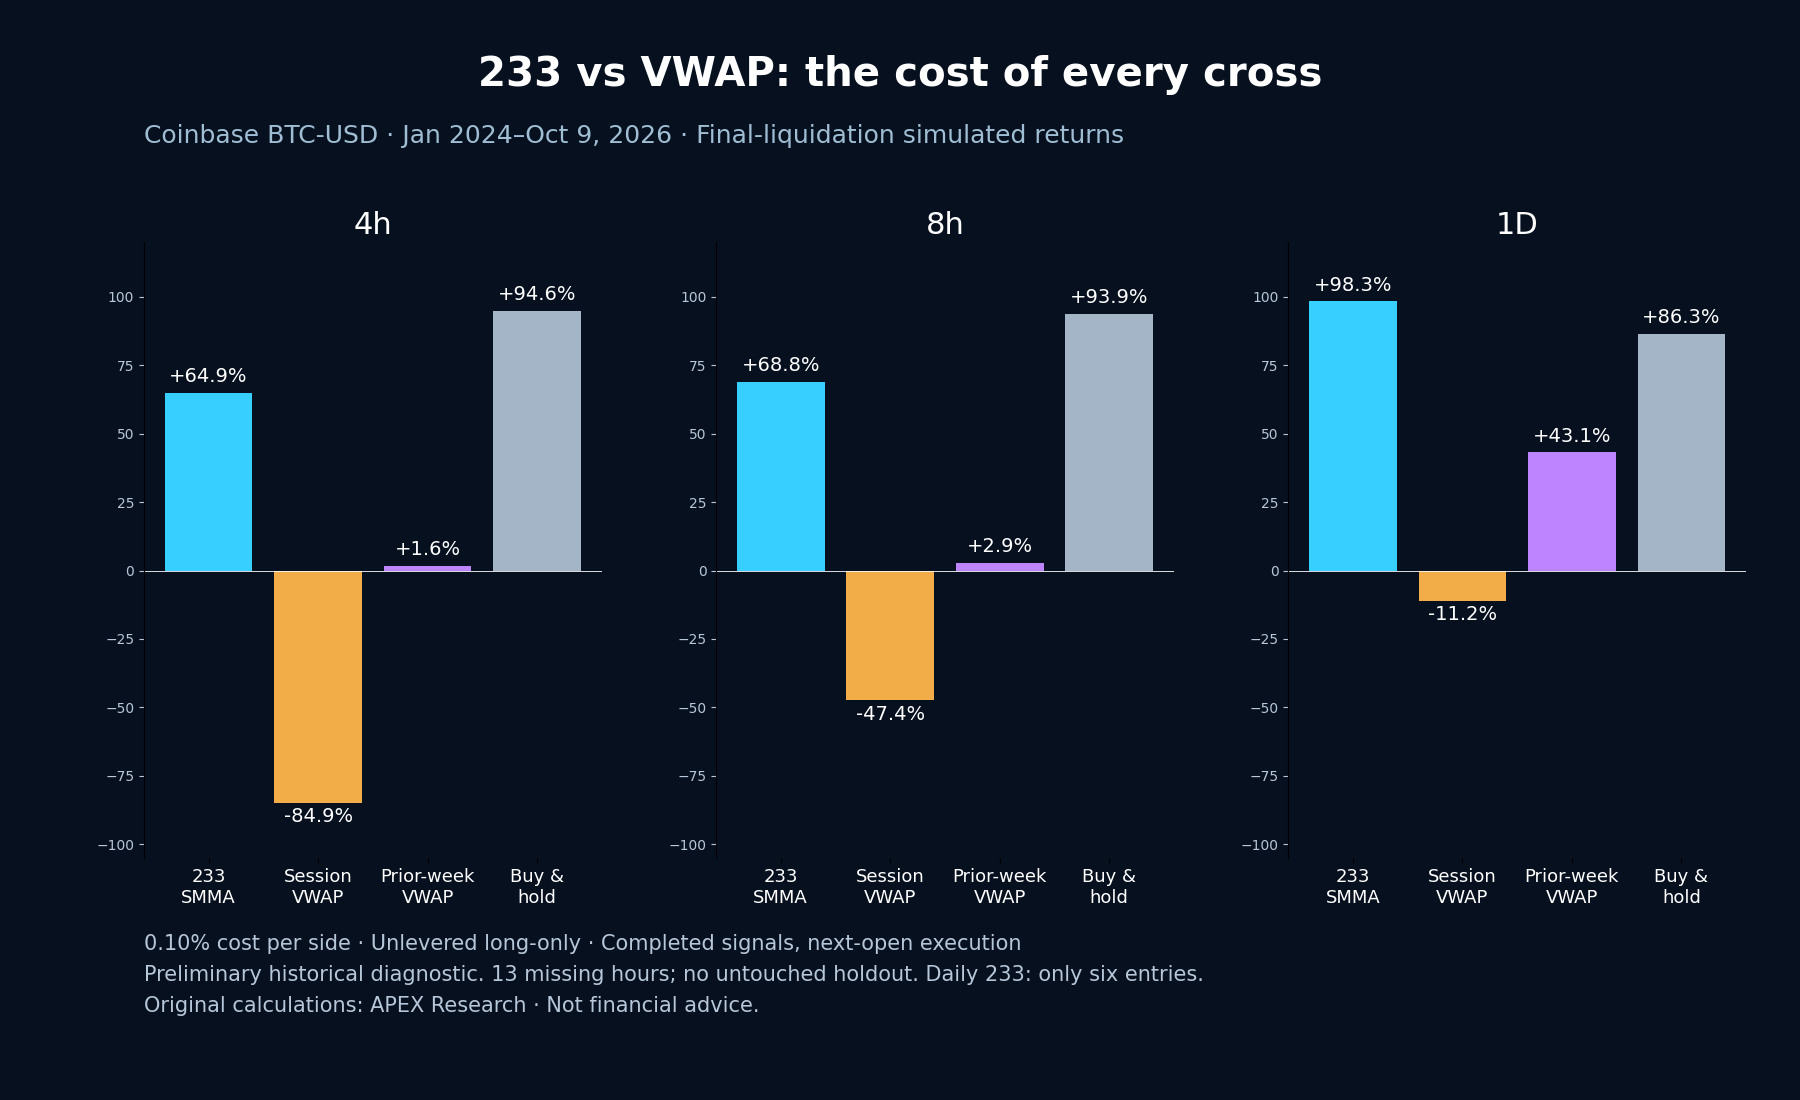
| Timeframe | 233 SMMA | Session VWAP | Previous-week VWAP |
|---|---|---|---|
| Four-hour | +64.9% | −84.9% | +1.6% |
| Eight-hour | +68.8% | −47.4% | +2.9% |
| Daily | +98.3% | −11.2% | +43.1% |
These are cumulative simulated returns across the evaluation period, not annual returns, forecasts or live account results.
The 233 rules entered 62 times on the four-hour test, 31 times on the eight-hour test and six times on the daily test. Session VWAP entered 1,077, 658 and 250 times respectively.
That difference is central to the result. A strategy that crosses a resetting session reference frequently can accumulate substantial friction. An indicator can look responsive while the rule used to trade it repeatedly pays to enter and exit.
Costs changed the ranking
Without costs, the eight-hour session-VWAP rule returned approximately +96.2%, compared with +79.6% for the eight-hour 233 rule. At 0.10% per side, those became approximately −47.4% and +68.8%.
The reversal tells us something specific: in this implementation, turnover made the session crossing rule fragile to transaction costs. It does not prove VWAP is useless. Session VWAP can serve as an execution reference or location tool within a broader setup; trading every cross is a separate proposition.
The choice of rule matters as much as the choice of line.
Buy-and-hold keeps the comparison honest
A good research report also asks whether the complicated rule beat simply holding the asset.
| Timeframe sampling | 233 rule return | Buy-and-hold return | 233 boundary drawdown | Hold boundary drawdown |
|---|---|---|---|---|
| Four-hour | +64.9% | +94.6% | −38.9% | −53.6% |
| Eight-hour | +68.8% | +93.9% | −32.7% | −53.4% |
| Daily | +98.3% | +86.3% | −30.9% | −53.1% |
The four-hour and eight-hour 233 rules earned less than their corresponding holding baselines while spending less time exposed and showing smaller drawdowns at the measured boundaries. The daily rule earned more in this sample—but with only six entries.
The baselines differ slightly because execution and measurement boundaries differ between timeframes. Drawdown is measured at bar boundaries; intrabar losses can be larger. None of these figures means the strategy was comfortable or safe to hold.
Why smoothness alone cannot choose the winner
Our separate mathematical experiment showed that an old anchored VWAP can react less than the 233 to a short price disturbance. Give that disturbance much heavier volume, and the VWAP reacts much more.
The 233 has fixed responsiveness. VWAP’s responsiveness depends on incoming volume relative to accumulated volume. A completed-range VWAP does not update at all.
Therefore, “fewer fakeouts” must be defined and measured. A quieter line can delay a useful entry, delay an exit, or miss a reversal. Its visual stability is not automatically an economic edge.
The Fibonacci identity explains the owner’s preference for 233. It does not independently prove predictive power.
What this study does not prove
This is a preliminary historical diagnostic. It compares complete crossing rules that generate different opportunities. It does not isolate a filter’s contribution using identical 21/55 entries, exits and risk rules.
It has not validated the owner’s full 21/55-plus-233 approach. It has not tested every anchored VWAP, every fixed range, multiple exchanges or gold futures. Nor does it establish statistical significance or performance on a genuinely untouched future period.
There are 13 missing hourly intervals across March 4, 2023; October 25, 2025; and May 8, 2026. Targeted recovery requests returned HTTP 403. Incomplete aggregate bars were omitted without fabricating replacements. That affects elapsed-time memory and exposure accounting around gaps. Gap-treatment sensitivity remains unresolved.
These limitations belong beside the headline numbers, not buried beneath them.
The next defensible experiment
The next comparison should hold the entry setup, exit, position size and costs constant, then add each filter separately. That will tell us whether 233, session VWAP or a registered fixed range improves the same opportunity set.
We also need gap sensitivity, event-anchored VWAP tests, finer execution data, additional assets and a forward validation period. Every tested variation must remain in the research ledger, including failures.
Until then, the strongest conclusion is narrow but useful: in this BTC sample, the simple 233 crossing rules survived the tested costs better than the session and previous-week VWAP crossing rules. The results support further investigation—not a universal trading instruction.
Indicators can organize information. The work is deciding what that information means, testing the decision, and managing the risk when the interpretation is wrong.
Not financial advice. Always trade with a plan and proper risk management.
Sources and credits
Original calculations and analysis: APEX Research. Owner’s 233 rationale attributed to the owner. Research date: October 9, 2026. Raw candle responses, formulas, simulated trades and cost scenarios are retained in the accompanying research batch. No third-party chart is reproduced.
• Coinbase Exchange candle documentation: https://docs.cdp.coinbase.com/api-reference/exchange-api/rest-api/products/get-product-candles
• TradingView VWAP: https://www.tradingview.com/support/solutions/43000502018-volume-weighted-average-price-vwap/
• TradingView Anchored VWAP: https://www.tradingview.com/support/solutions/43000669764-anchored-vwap-drawing-tool/
• TradingView Fixed Range Volume Profile: https://www.tradingview.com/support/solutions/43000480324-fixed-range-volume-profile-indicator/
• MetaQuotes moving-average formulas: https://www.mql5.com/en/articles/16308
• Bailey, Borwein, López de Prado and Zhu, *The Probability of Backtest Overfitting*: https://www.davidhbailey.com/dhbpapers/backtest-prob.pdf