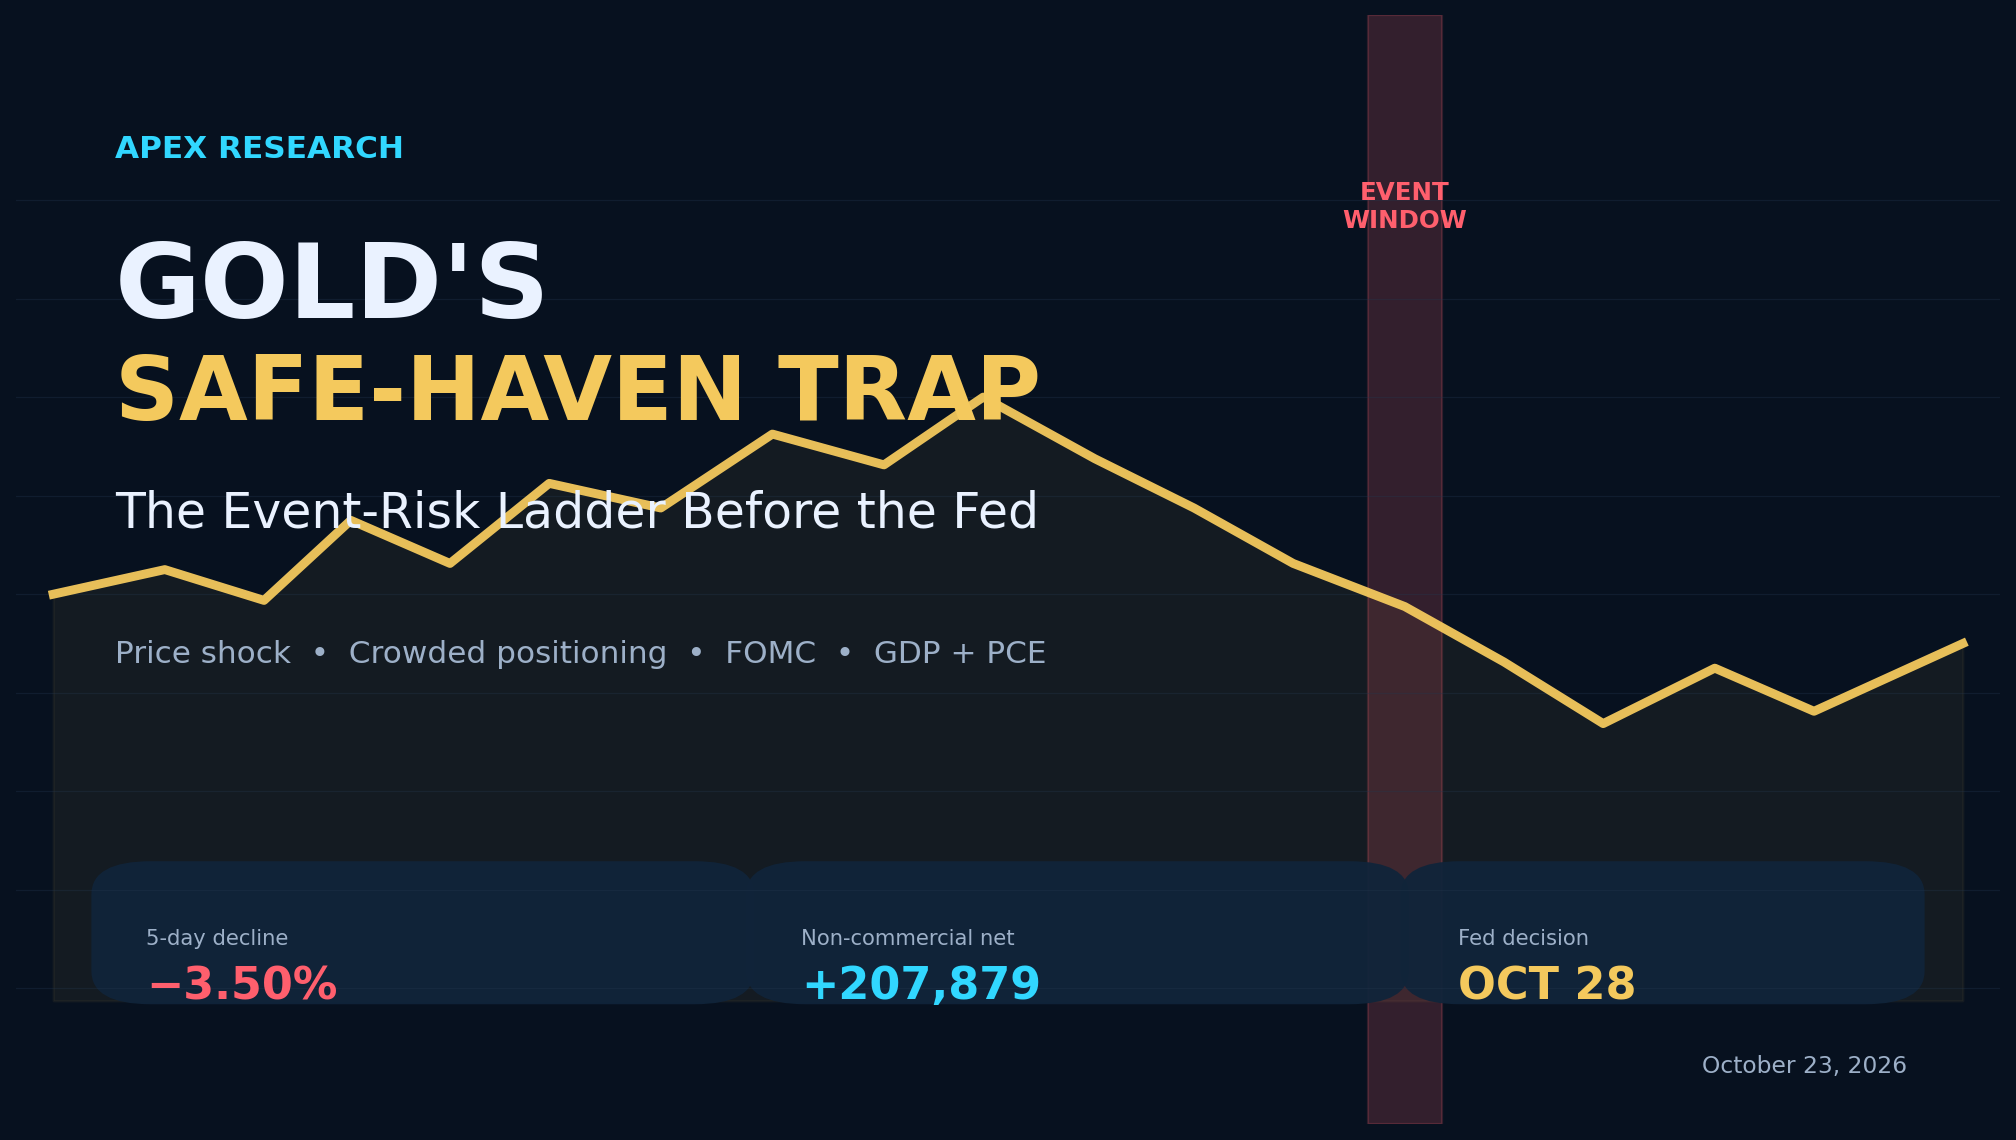
Gold enters the October 27–29 event week with three forces pulling at the same market: a sharp price break, a still-large speculative net-long position, and a tightly packed sequence of U.S. macro events. The safe-haven story has not disappeared. It has collided with the inflation-and-rates story.
That collision is the setup—not a forecast.
October 27 publication update: WSJ Market Data showed December gold at $4,010.30 at 5:51 a.m. Eastern, down 0.70%, with an intraday range of $4,001.60–$4,038.90. The October 26 settlement was $4,038.40. These are dated observations, not a live quote. The original October 16–22 price study and October 13 positioning chart below are retained as historical snapshots.
The newer CFTC futures-only report, covering October 20 positions, shows non-commercial gold longs of 237,142 and shorts of 37,277: net +199,865 contracts, down 8,014 from October 13. That is 49.68% of 402,279 open contracts. Speculative length remained substantial, but had already declined; the October 13 chart must not be read as the latest positioning report. A net-long share alone does not establish historical extremity or predict direction.
The market now moves toward durable-goods data on Tuesday, the Federal Reserve decision and press conference on Wednesday, then advance GDP and Personal Income and Outlays—including the PCE inflation data—on Thursday.
The APEX Gold Event-Risk Ladder is designed for that exact environment. It does not attempt to predict the data, the Fed, or the first violent price impulse. It waits for the market to show acceptance.
What the price structure actually shows
Sources: [7]
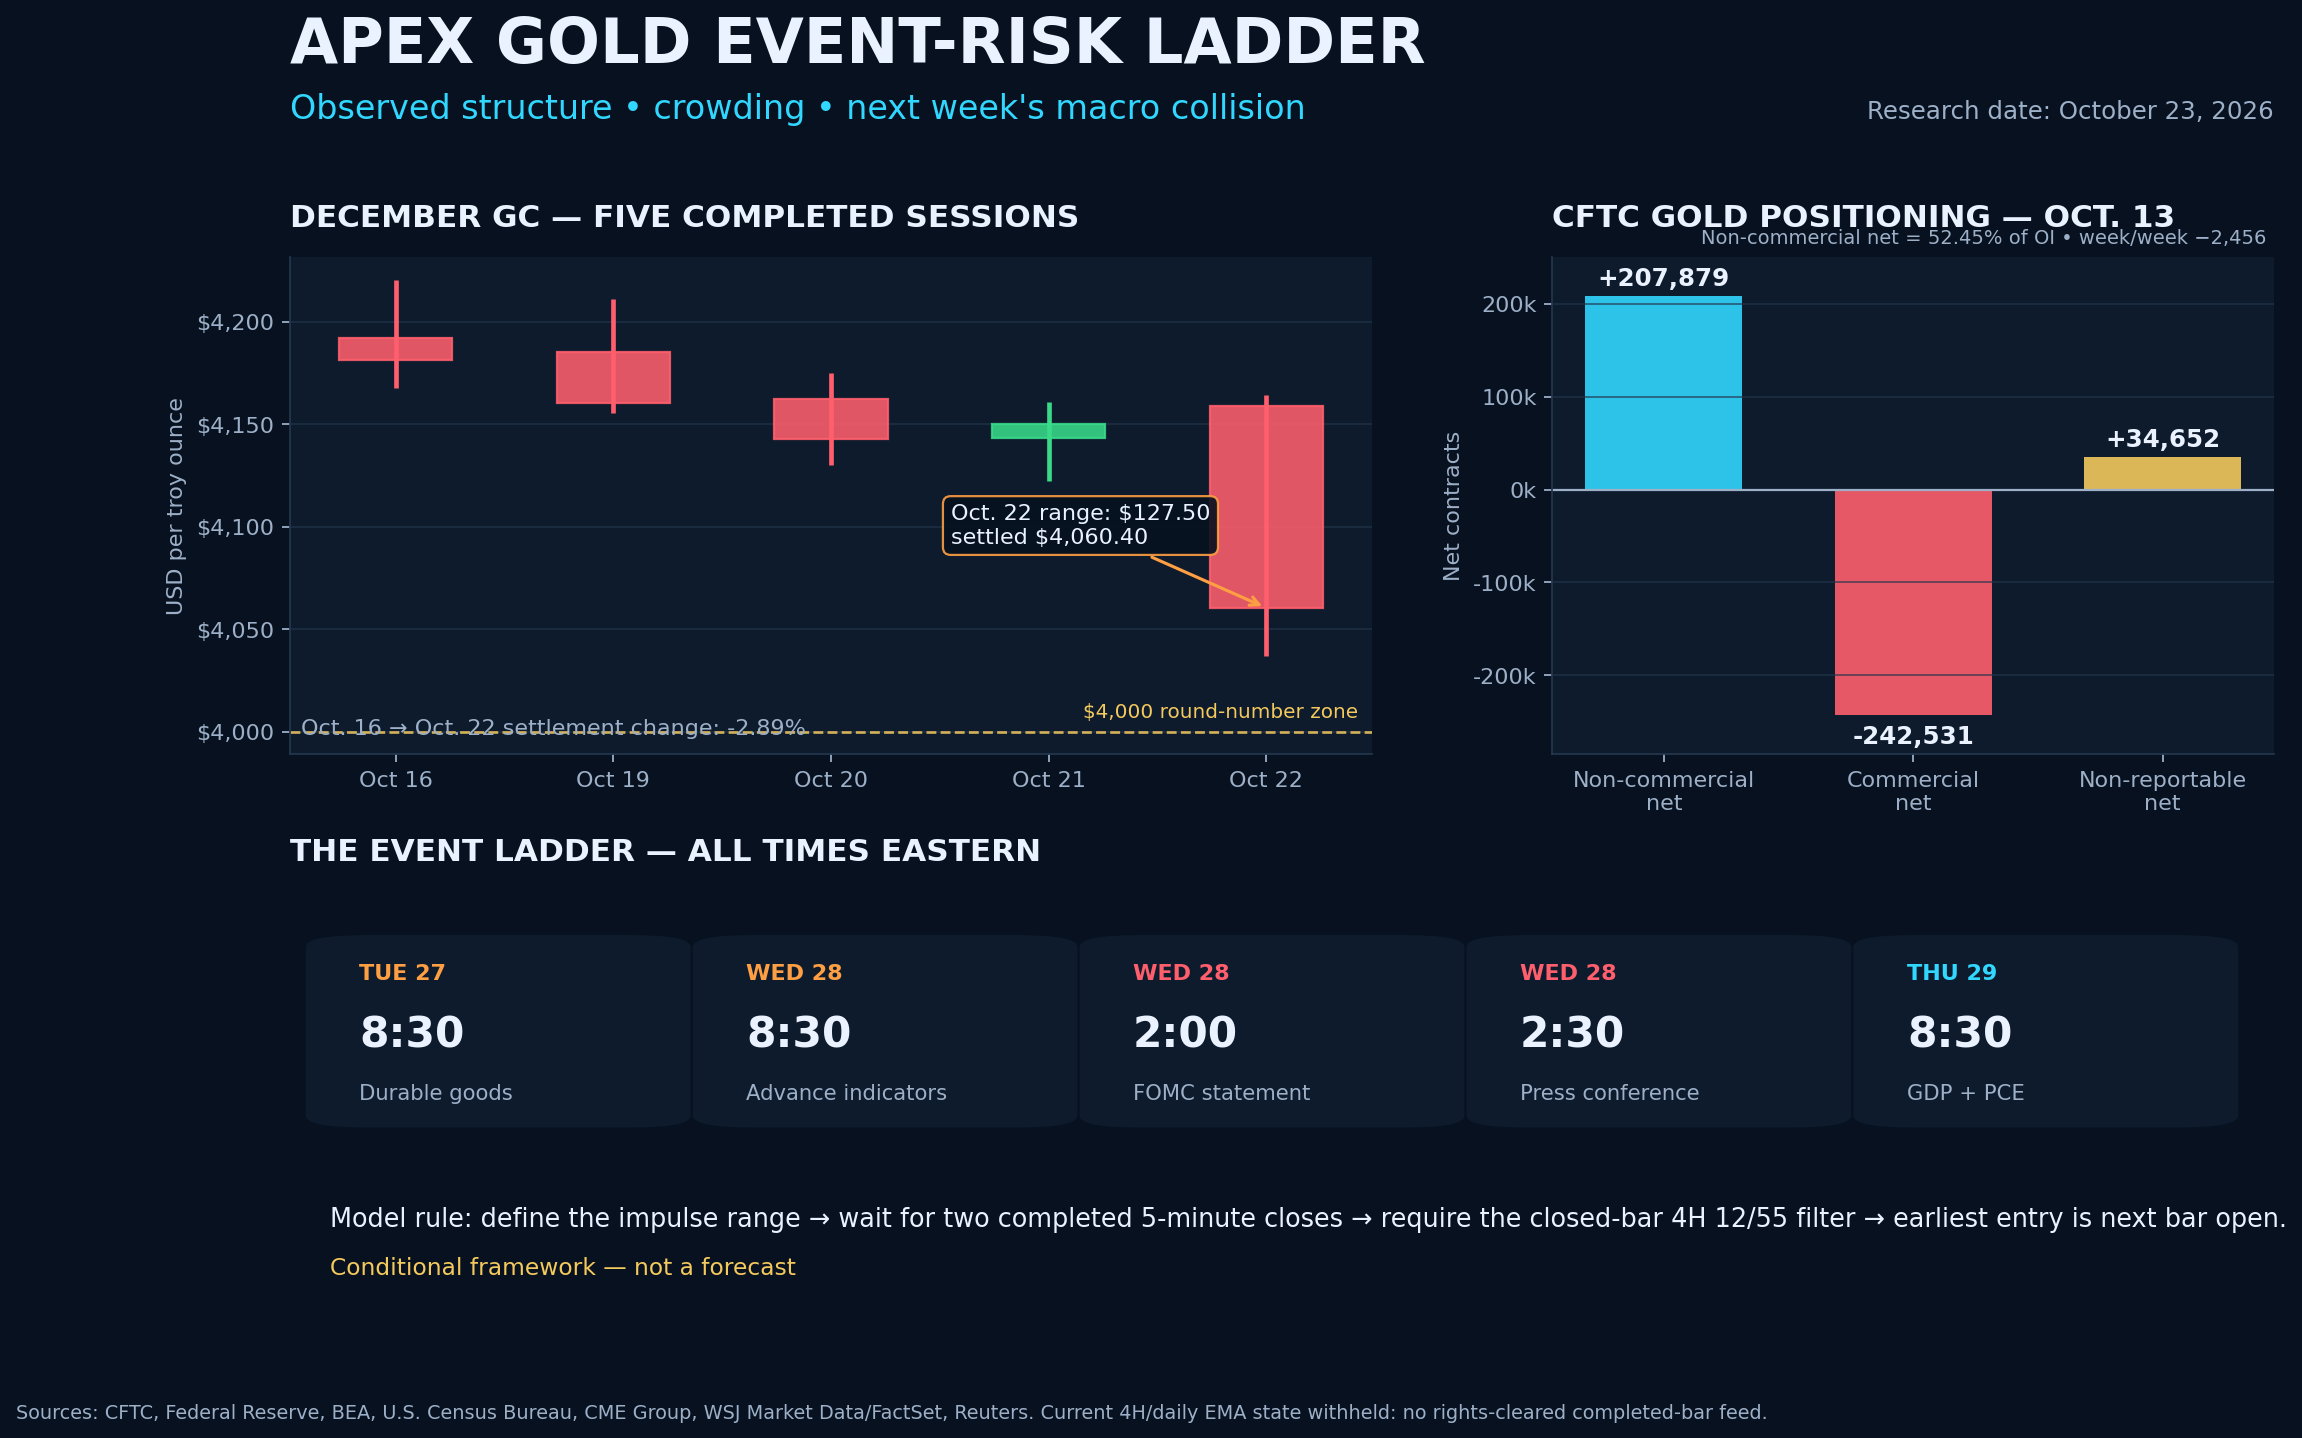
The five completed December GC sessions from October 16 through October 22 produced a clear loss of altitude:
| Session | Open | High | Low | Settlement |
|---|---|---|---|---|
| Oct. 16 | $4,192.10 | $4,220.40 | $4,167.50 | $4,181.10 |
| Oct. 19 | $4,185.00 | $4,211.20 | $4,155.60 | $4,160.10 |
| Oct. 20 | $4,162.40 | $4,174.90 | $4,130.10 | $4,142.60 |
| Oct. 21 | $4,143.40 | $4,160.60 | $4,122.30 | $4,150.00 |
| Oct. 22 | $4,159.00 | $4,164.30 | $4,036.80 | $4,060.40 |
From the October 16 settlement to the October 22 settlement, December GC fell 2.89%. The October 22 session alone covered $127.50 from high to low. WSJ Market Data’s broader continuous-contract summary showed a 3.50% five-day decline and a 6.49% one-month decline at the October 23 observation.
Those numbers establish volatility and downside pressure. They do not, by themselves, establish trend continuation. A large red candle can be the start of acceptance lower, or the final liquidation candle before a reversal. The next completed bars decide which one it was.
The round $4,000 region is a reference area near the dated October 27 December-GC quote, rather than a forecast or a guaranteed floor. But APEX does not treat a round number as support merely because it looks important on a chart. Support requires evidence: rejection, reclaim, and closed-bar acceptance above the area. Failure requires the opposite: repeated closes below it, not a temporary wick.
Positioning adds fuel, not direction
The original study used the CFTC legacy futures-only report for COMEX gold covering October 13 positions. The newer October 20 figures are disclosed in the publication update above; the table and chart below deliberately preserve the original snapshot.
| CFTC category | Long | Short | Net |
|---|---|---|---|
| Non-commercial | 245,300 | 37,421 | +207,879 |
| Commercial | 54,419 | 296,950 | −242,531 |
| Non-reportable | 50,731 | 16,079 | +34,652 |
Open interest was 396,345 contracts. Non-commercial net length equaled 52.45% of that open interest, and non-commercial longs outnumbered shorts 6.56 to 1. Yet the net position had already fallen by 2,456 contracts from the prior report because longs declined by 103 while shorts increased by 2,353.
That is a useful tension: speculators remained heavily net long, but the weekly change had turned less supportive before the latest price break. If downside acceptance continues, long liquidation can amplify it. If price rejects the lows and reclaims the event range, the same concentration can provide fuel for a fast recovery as shorts cover and sidelined buyers return.
This report does not label positioning historically extreme. That would require a clean multiyear percentile study. It also does not interpret commercial net shorts as a simple bearish bet; producer, merchant, processor and user positions frequently reflect hedging activity. COT is context, not a trigger, and it is lagged.
Why gold can fall during a geopolitical shock
Gold is often treated as a one-variable safe haven. October’s tape shows why that shortcut fails.
CME’s October 22 commentary linked pressure on non-yielding bullion to resilient economic data and hawkish Federal Reserve expectations. More generally, higher energy prices can add inflation pressure and change expectations for how long rates stay elevated. That matters because gold does not pay interest. When inflation expectations push nominal or real yields higher, the opportunity cost of holding bullion can rise—even while geopolitical risk is elevated.
The Federal Reserve’s September 16 statement raised the federal-funds target range by 25 basis points to 3.75%–4.00% and said inflation remained elevated. The next FOMC meeting is October 27–28. The statement is scheduled for 2:00 p.m. Eastern on Wednesday, followed by the press conference at 2:30 p.m.
The market therefore faces two competing gold narratives:
- Safe-haven demand: geopolitical escalation, financial stress, or rapid bond-market risk aversion can support gold.
- Higher-for-longer pressure: oil-driven inflation, a stronger dollar, or higher real yields can pressure a non-yielding asset.
APEX does not choose between those narratives in advance. It waits to see which one price accepts after the event.
The event ladder
All times below are Eastern:
| Date | Time | Scheduled event | Why it matters |
|---|---|---|---|
| Tue., Oct. 27 | 8:30 a.m. | Advance durable goods | Growth and demand signal before the Fed |
| Wed., Oct. 28 | 8:30 a.m. | Advance Economic Indicators | Trade and inventory context before the decision |
| Wed., Oct. 28 | 2:00 p.m. | FOMC statement | Policy decision and guidance |
| Wed., Oct. 28 | 2:30 p.m. | FOMC press conference | Repricing risk often continues or reverses here |
| Thu., Oct. 29 | 8:30 a.m. | Advance Q3 GDP + Personal Income and Outlays | Growth plus the Fed’s preferred inflation measure |
The most dangerous assumption is that Wednesday’s first move must be the real move. The statement can produce one impulse; the press conference can validate it, reverse it, or create a second range entirely. Thursday’s GDP and PCE releases can then reopen the same debate.
The APEX Gold Event-Risk Ladder
Step 1 — Define the event box
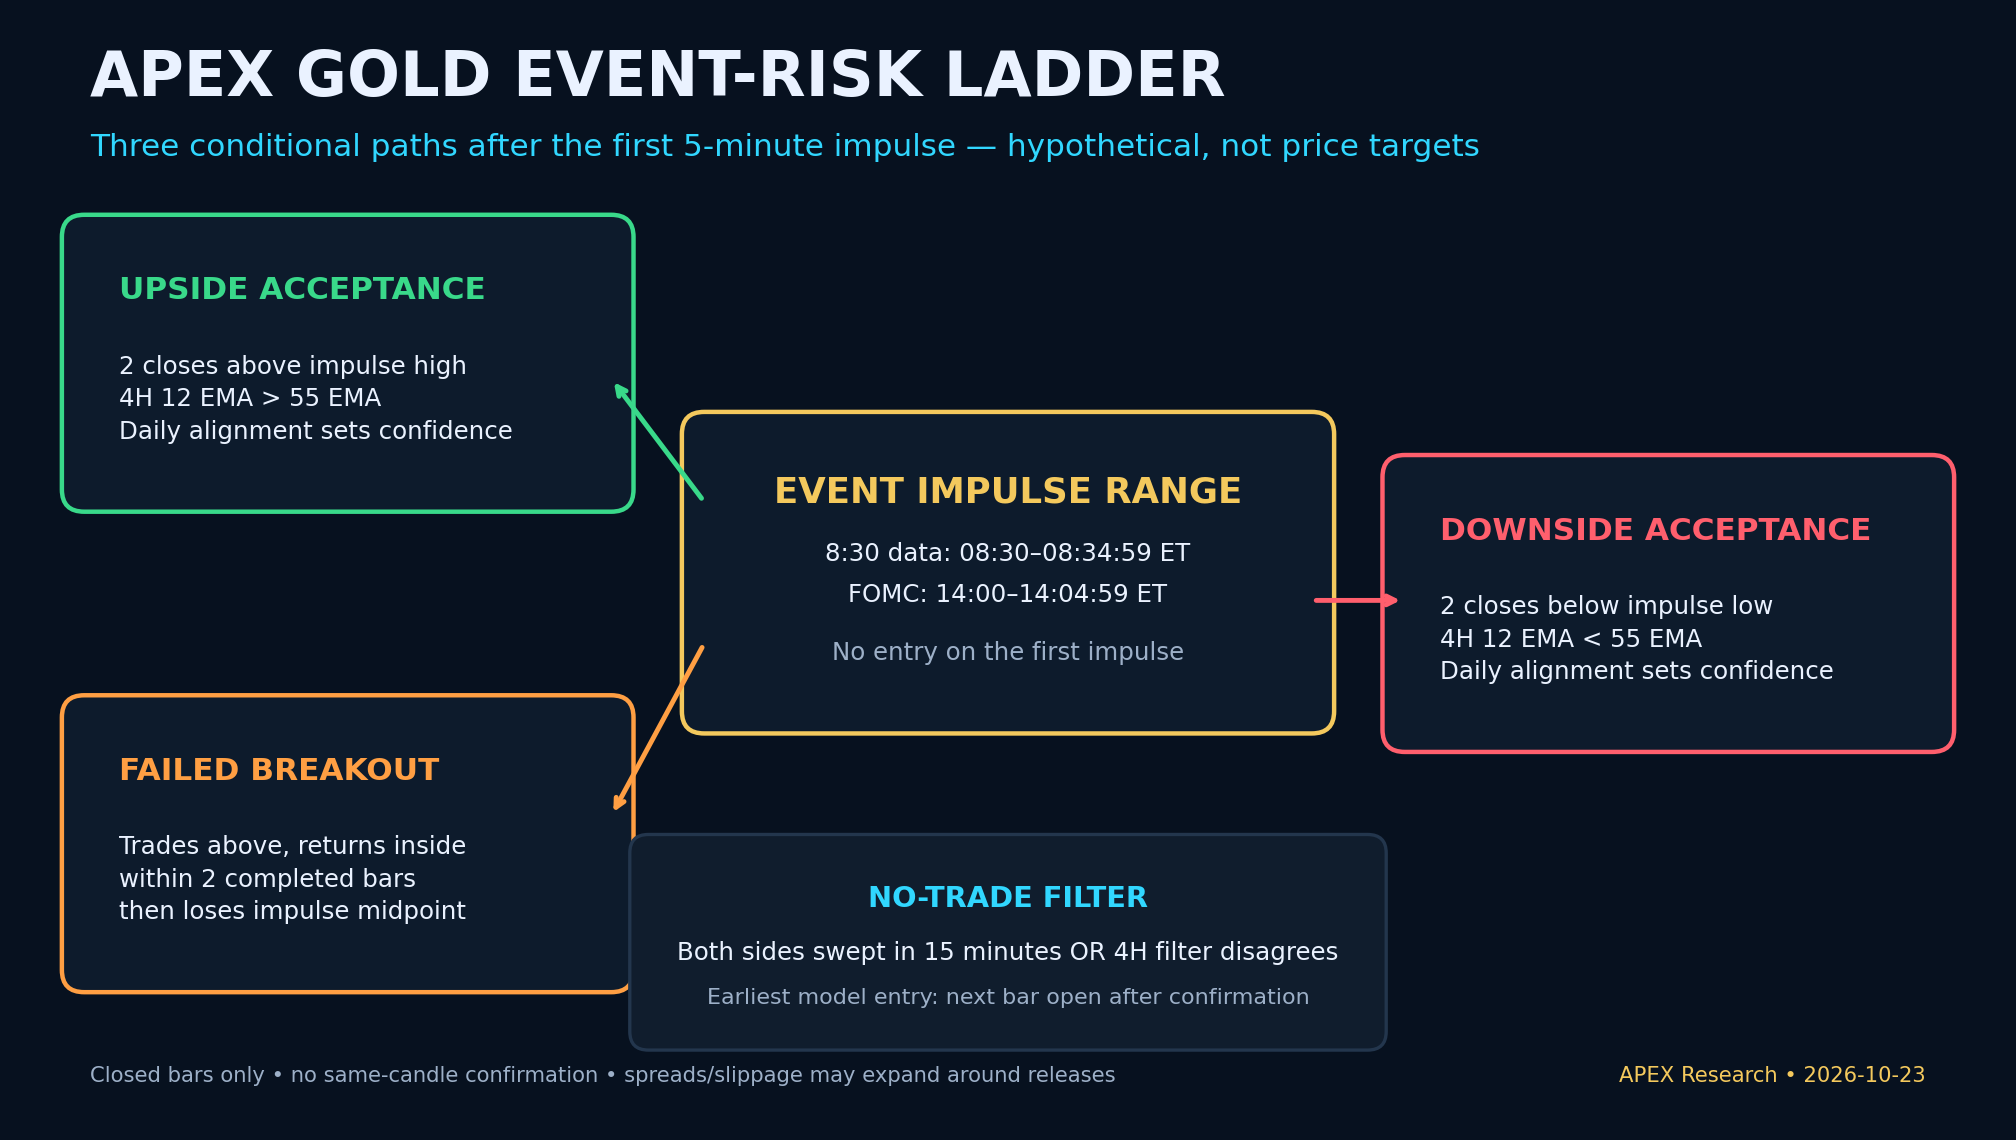
For an 8:30 a.m. release, record the pre-event range from 8:20:00 through 8:29:59. Define the first impulse as the 8:30:00–8:34:59 five-minute bar.
For the FOMC, record the pre-event range from 1:50:00 through 1:59:59 p.m. Define the first impulse as the 2:00:00–2:04:59 five-minute bar.
No entry is allowed on the first impulse. That rule prevents the model from converting surprise volatility into a same-candle hindsight signal.
Step 2 — Require acceptance
Acceptance requires two consecutive completed five-minute closes beyond the same side of the impulse range. The earliest model entry is the next bar’s open.
One close is information. Two closes are confirmation. A wick is neither.
Step 3 — Apply the 12/55 regime filter
The owner’s chart-model framework uses the 12/55 EMA cross on daily and four-hour bars. Both are evaluated only after the bar closes.
| State | Daily 12/55 | 4H 12/55 | APEX interpretation |
|---|---|---|---|
| +2 | 12 above 55 | 12 above 55 | Upside alignment |
| +1 | 12 below 55 | 12 above 55 | Countertrend rebound |
| −1 | 12 above 55 | 12 below 55 | Rally-failure risk |
| −2 | 12 below 55 | 12 below 55 | Downside alignment |
The current 12/55 state is intentionally not printed here. This run did not have a rights-cleared, completed four-hour history sufficient to calculate it. Publishing an inferred or screenshot-derived state would create false precision. This is a conditional educational framework, not a backtested strategy or a current trading signal. Confirm any daily and four-hour filter independently on the chosen contract and feed using completed bars; no current filter state or trade is asserted here.
Step 4 — Classify the path
Path A: Upside acceptance
Two completed five-minute closes above the impulse high, with the four-hour 12 EMA above the 55 EMA. A positive daily filter creates full timeframe alignment. A negative daily filter keeps the move classified as a countertrend rebound. The path is invalidated if price closes back through the impulse midpoint and fails to reclaim it on the next completed bar.
Path B: Failed breakout
Price trades above the impulse high but returns inside the range within two completed five-minute bars, then closes below the impulse midpoint. This is not automatically a short. It is a warning that the first bullish narrative failed. Downside confirmation still requires acceptance below the impulse low and agreement from the four-hour filter.
Path C: Downside acceptance
Two completed five-minute closes below the impulse low, with the four-hour 12 EMA below the 55 EMA. A negative daily filter creates full downside alignment. A positive daily filter classifies the move as countertrend weakness. Invalidation is a close back through the impulse midpoint followed by a successful reclaim.
No-trade state
If price sweeps both sides of the impulse range during the first 15 minutes, or if the confirmation direction disagrees with the four-hour filter, the model stands down. The purpose of the ladder is to remove weak conditions, not to force a trade from every event.
What would change the thesis?
The current thesis is not “gold is bearish.” It is: gold is vulnerable to unusually large two-way repricing because price has broken lower, speculative positioning remains substantially net long, and major growth, inflation and policy events are compressed into three sessions.
That thesis weakens if:
- Price reclaims the October 22 range and holds above it on completed bars.
- The four-hour 12/55 filter turns positive and the daily filter confirms.
- The next CFTC report shows that speculative length has already been materially reduced, lowering liquidation pressure.
- Event responses become smaller rather than larger, showing that the market has absorbed the macro conflict.
It strengthens if:
- Rebounds repeatedly fail below the October 22 range.
- The four-hour and daily 12/55 filters align negative.
- Price accepts below the event impulse lows after two completed closes.
- The next positioning report shows net length stayed high despite further price weakness.
None of those conditions is a guarantee. They are observable tests that can invalidate or reinforce the thesis without rewriting the rules after the outcome.
Risk belongs before the signal
Sources: [6]
CME’s benchmark GC contract represents 100 troy ounces; Micro Gold represents 10 troy ounces. That ten-to-one difference matters during event volatility.
The risk formula is simple:
Dollar risk per contract = stop distance in dollars per ounce × contract ounces.
An $8 stop represents $800 of price risk on one GC contract and $80 on one MGC contract, before commissions, fees and slippage. Around macro releases, the actual fill can be worse than the planned stop. Position size must therefore come from a predefined dollar-risk limit—not from confidence in a headline or the apparent strength of the first candle.
For 30-second scalping, the 30-second chart can refine execution only after the five-minute confirmation exists. It cannot replace the higher-timeframe filter or turn an unfinished bar into evidence.
What traders should take from this
Gold is not giving traders a clean safe-haven story. It is presenting a conflict between geopolitical demand and the inflation-rate channel, while positioning creates fuel for either continuation or reversal.
The APEX response is not to guess harder. It is to make the market prove acceptance:
- Define the event range.
- Ignore the first impulse.
- Wait for two completed five-minute closes.
- Require the closed-bar four-hour 12/55 filter.
- Use the daily 12/55 state to distinguish alignment from countertrend movement.
- Enter no earlier than the next bar open.
- Invalidate the path when the impulse midpoint is lost and not reclaimed.
The first move tells you what surprised the market. The second and third completed bars tell you whether the market believed it.
Not financial advice. Always trade with a plan and proper risk management.
Sources and attribution
- CFTC — CMX futures-only Commitments of Traders, gold code 088691, positions dated October 13, 2026.
- Federal Reserve — 2026 FOMC calendar, including the October 27–28 meeting.
- Federal Reserve — September 16, 2026 FOMC statement.
- U.S. Bureau of Economic Analysis — release schedule, including October 29 GDP and Personal Income and Outlays.
- U.S. Census Bureau — Advance Economic Indicators schedule and Advance Durable Goods release.
- CME Group — Gold futures, Micro Gold futures, and October 22 gold market commentary.
- WSJ Market Data / FactSet — Gold Continuous Contract, observed October 23, 2026 at 7:51 a.m. ET.
- Publication refresh: CFTC gold futures-only report, positions as of October 20, 2026, and WSJ Market Data / FactSet, observed October 27, 2026 at 5:51 a.m. ET. The refreshed figures are distinguished from the original study charts.
Author: APEX Research
Chart design and model: APEX Research
Original research date: October 23, 2026; publication facts checked October 27, 2026
Original observation window: October 13–23, 2026; October 27 publication update uses October 20 CFTC positions and a dated October 27 quote; scheduled events October 27–29, 2026
Sources: CFTC, Federal Reserve, U.S. Bureau of Economic Analysis, U.S. Census Bureau, CME Group, WSJ Market Data/FactSet. Full qualification notes are preserved in SOURCES.md.