APEX Research · September 18, 2026 · Study v1.0 Summary: DOGE’s proposed October–December timing cluster is worth testing, but the calendar cannot establish direction. A fresh audit separates historical intervals from future projections, corrects an anniversary date and defines a prospective price-response test that can fail.
Instrument: Dogecoin (DOGE), with any future price test specified as DOGE/USD spot on a single named exchange. Timeframe: calendar days and completed daily UTC candles; no current market quote is asserted. Research checked: September 18, 2026. Author: APEX Research; research and calculation draft prepared with Codex for owner review. Timing hypothesis originates in the owner’s September 16 APEX DOGE study, based on an owner-supplied TradingView DOGEUSD daily logarithmic snapshot. This is a new companion study, not a replacement for that source image.
The useful question
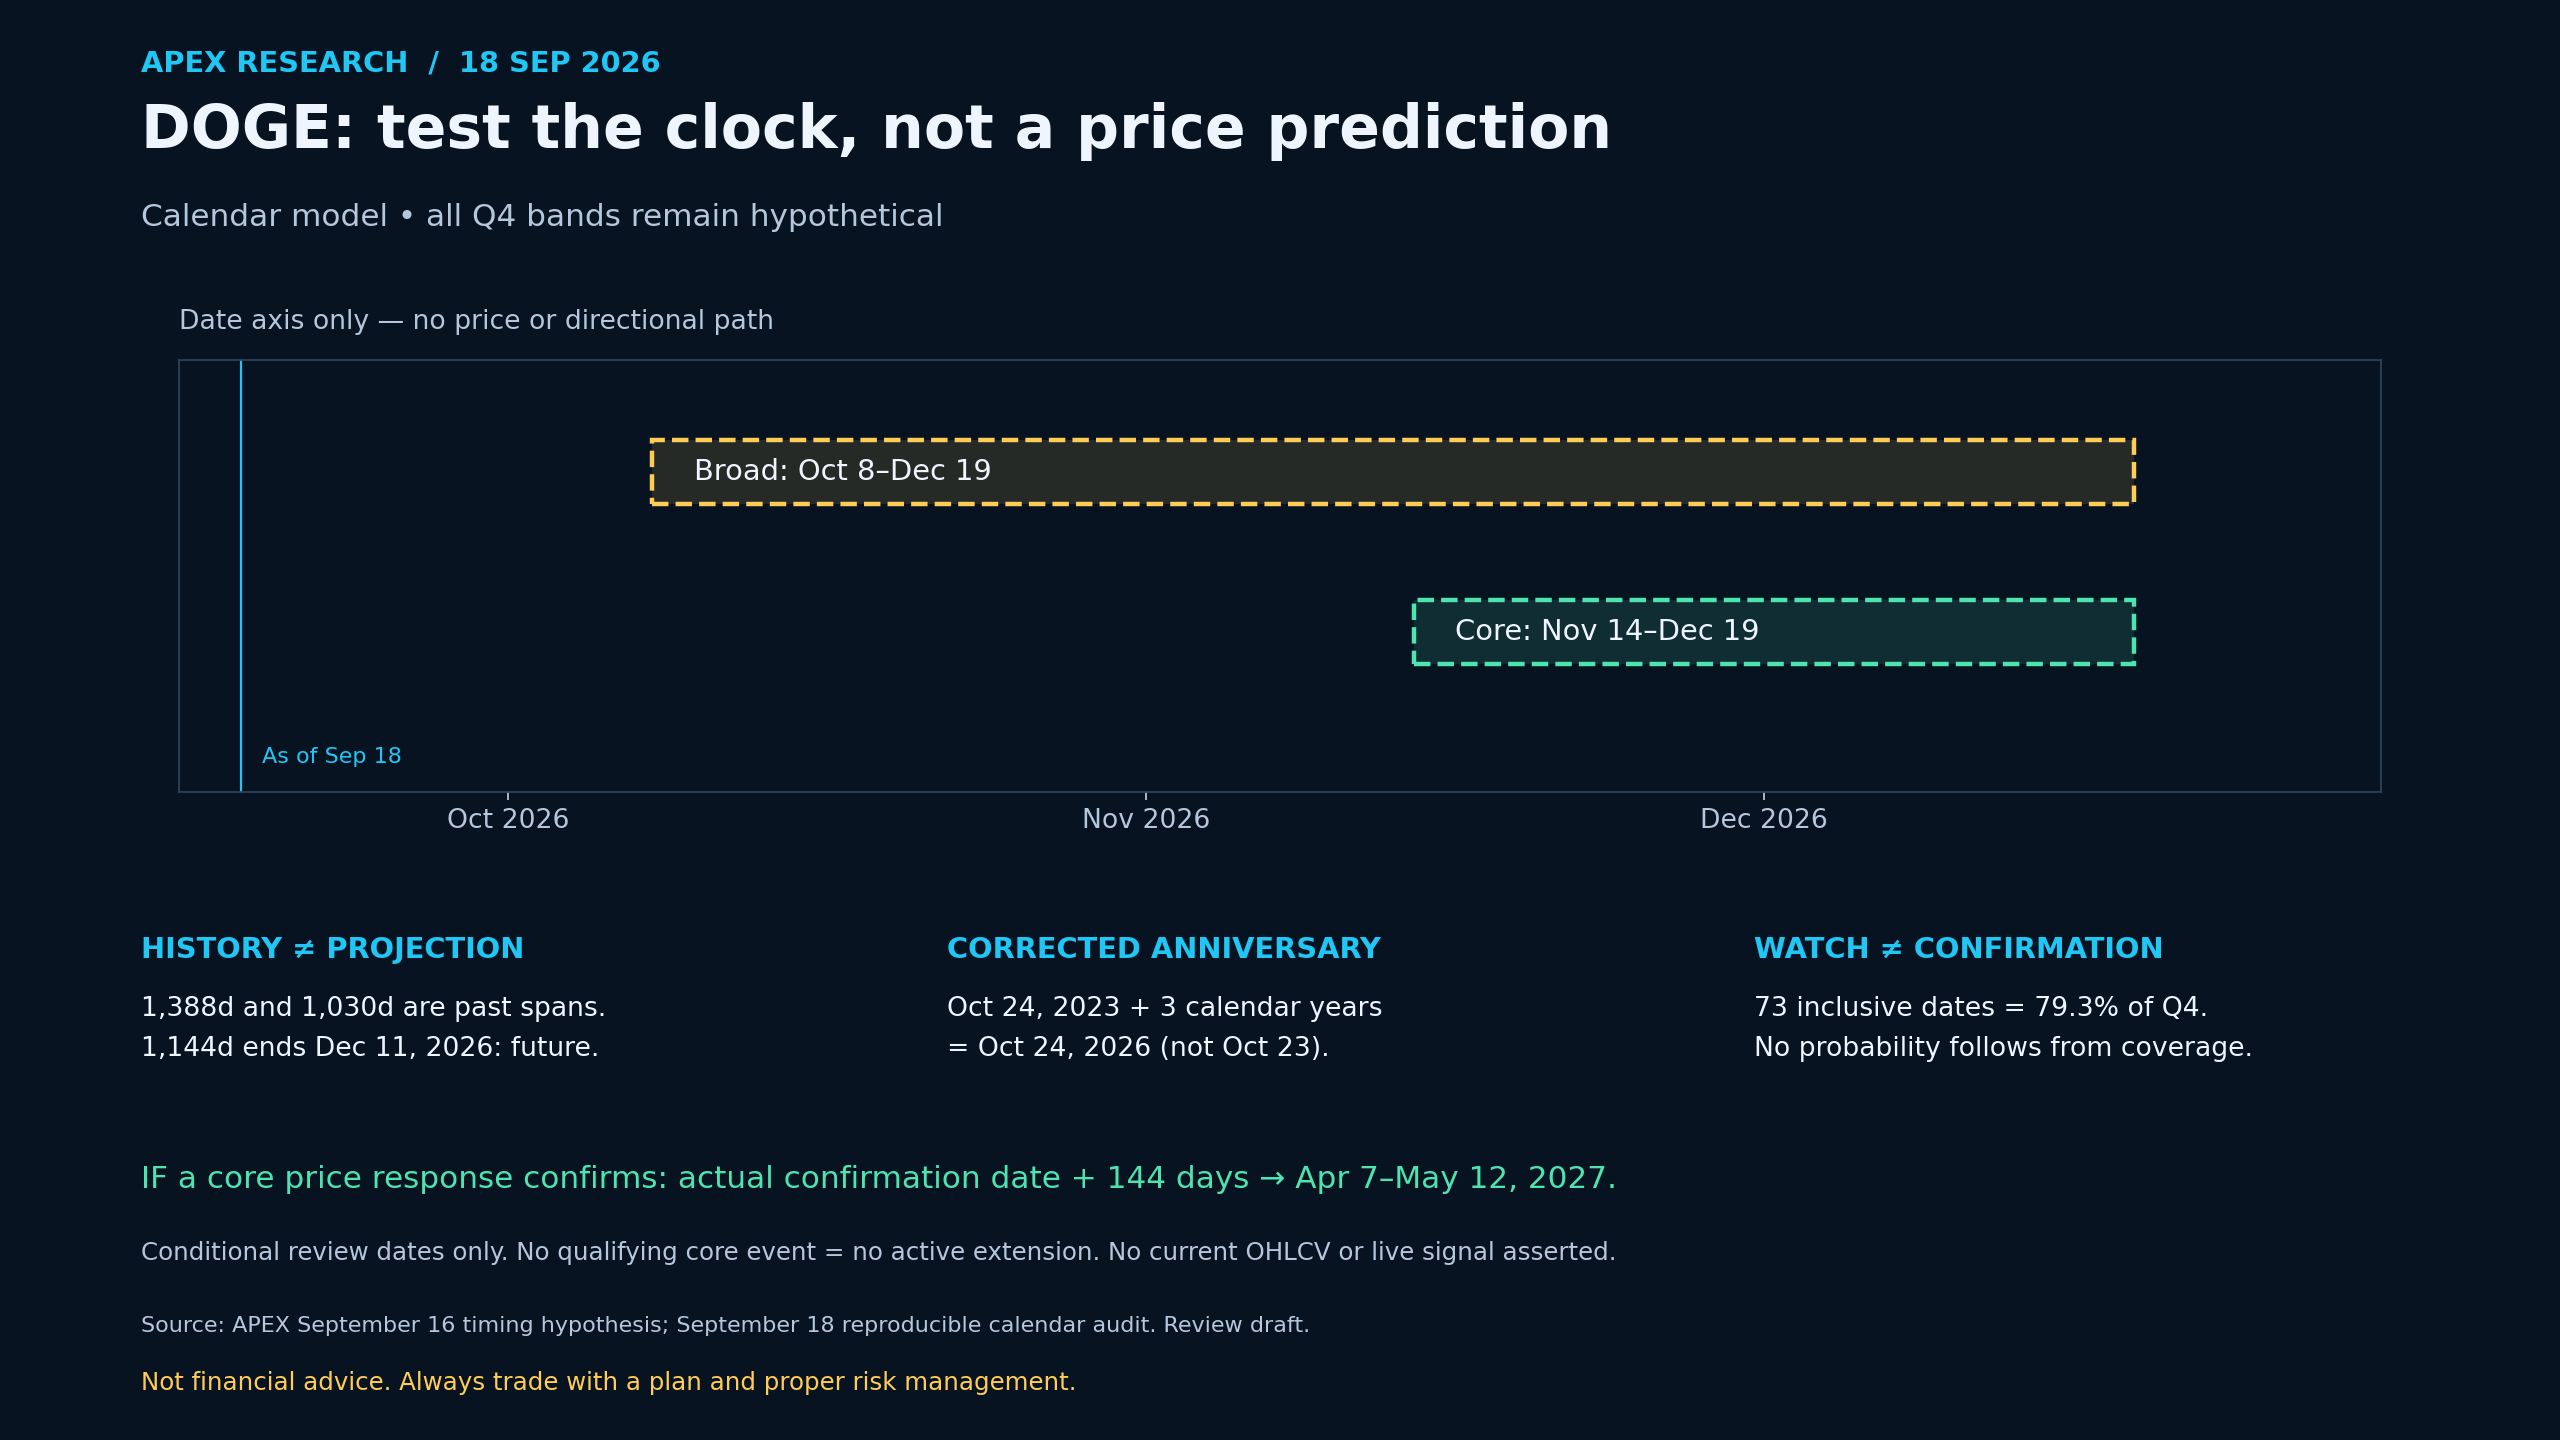
The interesting part of a cycle model is not whether several dates can be made to sit near one another. It is whether the model says something testable before the market gets there. For DOGE, the proposed broad window runs from October 8 through December 19, 2026, with a narrower November 14–December 19 core. As of this study’s date, both windows are ahead of us.
APEX’s interpretation is deliberately limited: these dates can organize observation. They cannot, by themselves, establish accumulation, distribution, a breakout, a top or a bottom. The right next step is to freeze the calendar and define the price evidence in advance—not to convert a timing idea into a directional forecast.
Dogecoin is the native cryptocurrency of the Dogecoin network, not an equity or a similarly named token. Its official site describes an open-source, peer-to-peer digital currency. That identity does not establish any market-cycle claim. Dogecoin project
First separate the record from the projection
The September 16 model supplied three selected anchor intervals. Recalculating elapsed calendar days gives:
| Selected start | Selected endpoint | Elapsed days | Status on September 18, 2026 |
|---|---|---|---|
| March 11, 2017 | December 28, 2020 | 1,388 | Both dates historical; anchor significance is inherited, not independently price-validated here |
| December 28, 2020 | October 24, 2023 | 1,030 | Both dates historical; same qualification |
| October 24, 2023 | December 11, 2026 | 1,144 | Future-endpoint projection—not a third observed cycle |
The distinction matters. There are two completed selected intervals, not three completed successes. Their lengths differ by 358 days; the second is about 25.8% shorter than the first. That is not an exact recurring three-year period. It does not rule out a useful hypothesis, but it prevents the future endpoint from being counted as historical confirmation.
Even the two historical spans are not a statistically established sample of market turns. The source dates were selected by the earlier study. This review verifies the arithmetic, not that each date is the uniquely correct pivot on every exchange. A price-history audit would need the original venue, candle convention and explicit pivot-selection rule.
Rebuilding the Q4 calendar
The following calculations use ordinary elapsed days, without counting the start date as day one. The anniversary uses calendar years rather than an assumed 365-day year.
| Starting date and operation | Result | Role in the hypothesis |
|---|---|---|
| October 24, 2023 + 1,080 days | October 8, 2026 | Broad-window opening |
| May 8, 2021 + 1,980 days | October 9, 2026 | Nearby opening calculation |
| October 24, 2023 + 3 calendar years | October 24, 2026 | Anniversary; corrects October 23 in the prior visual |
| May 8, 2021 + 14 × 144 days | November 14, 2026 | Core-window opening |
| June 18, 2022 + 1,620 days | November 24, 2026 | Interior calculation |
| October 24, 2023 + 8 × 144 days | December 19, 2026 | Broad/core closing boundary |
These are reproducible date calculations. They are not six independent market observations: three reuse the October 2023 anchor, two reuse the May 2021 anchor, and one uses June 2022. Repeated arithmetic from shared inputs can look like stronger evidence than it is. No probability of success follows from the number of labels on the chart.
The supplied 138-day and 146-day fast-phase comparisons average 142 days, two days short of 144. Their underlying start/end candles were not available for independent checking here, so they are not used as new confirmation or as a calibrated forecast.
How wide is the claim?
October 8–December 19 covers 73 dates when both endpoints are included: roughly 79.3% of Q4’s 92 dates. The core covers 36 dates. A market event somewhere inside a broad window is therefore a much weaker finding than an exact-date prediction might suggest.
As a sensitivity illustration—not a change to the model—allowing seven days on either side expands the broad range to October 1–December 26: 87 dates, or about 94.6% of the quarter. The lesson is to resist widening the window after the fact. This percentage measures calendar coverage, not the chance of a market turn; turns are neither independent nor uniformly distributed.
The academic warning is relevant but should not be overstated. Bailey, Borwein, López de Prado and Zhu study how selecting strategies from repeated tests can produce misleading backtest results. Their work does not test this DOGE hypothesis or assign it a failure probability. It supports the need to distinguish exploratory pattern selection from a genuinely prospective test. The Probability of Backtest Overfitting, February 2015
A prospective test with an expiry date
The following is a proposed research protocol for owner review. It is not an existing APEX trading-engine rule, recommendation or change to official scenario weights. Its purpose is to make this particular hypothesis falsifiable.
Freeze the inputs before October 8. Choose one DOGE/USD spot venue and retain it throughout. Use completed UTC daily candles. Define H as the highest high and L as the lowest low of the 20 dates from September 18 through October 7, inclusive. Archive the source, retrieval timestamp and all 20 OHLCV rows. H and L cannot be filled in today because that baseline period has not finished.
Upward price-response candidate. Within October 8–December 19, require two consecutive completed daily closes strictly above H. The second close is the confirmation timestamp. An intraday spike or a single close does not qualify. A subsequent daily close at or below H invalidates that breakout interpretation. A later higher low above H would strengthen the interpretation, but is not retroactively required to rescue or reject the initial test.
Downward price-response candidate. Apply the symmetric rule: two consecutive completed daily closes strictly below L, with the second close as confirmation. A subsequent daily close at or above L invalidates that breakdown interpretation. A later lower high below L would strengthen it.
No qualifying response. If neither rule qualifies by the completed December 19 UTC candle, record the timing hypothesis as unconfirmed under this protocol. Do not roll its closing date forward. If both directions qualify at different times, retain the first signal as the primary test, record any invalidation and log the later event separately. Do not select whichever direction looks best afterward.
This protocol detects a response outside a fixed reference range. It does not prove a reversal, an Elliott wave, a Wyckoff phase or a causal influence of calendar cycles. A price response also needs comparison with similarly constructed non-window periods before anyone can claim an edge. Costs, slippage and position sizing are outside this research test; no strategy return is claimed.
What the 144-day extension actually means
If a qualifying confirmation occurs inside the November 14–December 19 core, an observation date 144 elapsed days after that confirmation falls between April 7 and May 12, 2027. For example, November 14 + 144 days is April 7; December 19 + 144 days is May 12.
Those are conditional review dates, not destinations for price. Use the actual confirmation date, not whichever endpoint later fits the chart. A confirmation outside the core does not activate this core-specific extension. An invalidated breakout remains invalidated even if its review date is still on the calendar. Without a qualifying core event, there is no active extension to evaluate.
The new calendar graphic uses dashed future bands and contains no synthetic candles or price trajectory. It also makes no Gann Price = Time or 1×1 claim. Such claims would require documented price normalization and scale; date arithmetic alone is insufficient. No Elliott count, Fibonacci price target, liquidity level or fair-value gap is asserted without the necessary price evidence.
What would change the thesis?
The most important improvement would be an independently verifiable price dataset supporting the anchor choices, followed by an unchanged, timestamped protocol evaluated prospectively. A clean range exit during the frozen window would support a price-response observation; a failed exit, no qualifying event or a result no better than comparison periods would weaken the timing interpretation.
Fundamentals cannot be inferred from a calendar either. Dogecoin’s official supply explanation says issuance continues without an end date. That is context for network economics, not proof of an imminent rally or crash. Any later price or market-cap target would need dated supply and market evidence; none is supplied here. Dogecoin issuance explanation
Data boundary and conclusion
Current exchange candle data could not be retrieved during this review. No September 18 price, volume, momentum reading or active signal is claimed. Coinbase’s primary documentation identifies timestamped OHLCV buckets and warns that historical data can be incomplete; missing candles must be checked, not silently invented. A future dataset must be validated for the chosen instrument, dates, duplicates and gaps. Coinbase candle documentation
The finished research result today is narrower and more useful than a price forecast: an auditable calendar, a corrected historical/projection boundary, an explicit sensitivity check and a proposed test that can expire without success. Time provides the appointment. Price still has to provide the evidence.
What is new in this September 18 companion
Compared with the preserved September 16 visual: the future-ended 1,144-day span is explicitly classified as projected; the three-year anniversary is corrected to October 24; Q4 coverage and seven-day sensitivity are calculated; shared-anchor dependence is explained; and a new prospective daily-close protocol defines confirmation, invalidation, expiry and the conditional 144-day review. No past image or prior model was overwritten.
Credits and sources: Original hypothesis: APEX Research / owner-supplied September 16 TradingView DOGEUSD daily log study. New calendar calculations and protocol: APEX Research review draft, September 18, 2026. Dogecoin Project; Coinbase Developer Platform; David H. Bailey, Jonathan M. Borwein, Marcos López de Prado and Qiji Jim Zhu. External sources above were accessed September 18, 2026; source access does not imply a newly published source or a current price observation.
Not financial advice. Always trade with a plan and proper risk management.